Made with Claude
Technical Concepts - Explained
Context: Advanced concepts around experimentation and modeling require a bit more of a hands on approach to learn by doing the calculations. Borrowing from Brilliant, I wanted to create a series of interactive elements to explain concepts around why media tests should go longer. While the axis, and values are incorrect, the concept of how an ‘expanding window’ lands a lot easier with this assistance.
Results: Going to work more artifacts into our learning management system.

Conditional Validation Drop Down
Context: I have to select a category and a sub category to find the right point of contact for a given issue. The challenge is the sets of issues are a subset of the category which makes people using the template get overwhelmed by options in the sub category if its not pre-filtered. I wanted to create a Google Sheets conditional data validation drop down and make it more configurable for use in copy and pasting.
Results: More people using the template and easier to navigate.
Automating Raw Data 2 Google Slides
Context: Automation around raw data tabs to client-ready Google Slides is quite a process. Using Claude I automated
Results:
Row Repeat for UI -> Google Sheet
Context: Copy Pasting from our tool’s web UI and then putting them back into a table for Google Sheets took too long. This script simplifies it to be a simple enter the number of rows before a repeat and receive the final table.
Results:
Cook’s Distance Explainer
Context: Cook’s Distance is a stats concept to see how outliers impact the slope of a regression line. I wanted to share different ways for understanding the impact of advertising on daily observations when we flag or dummy out certain days that have reasonable reasons why they should not be included in the dataset.
Results: De-jargon what I am trying to accomplish to my eng team with a working prototype
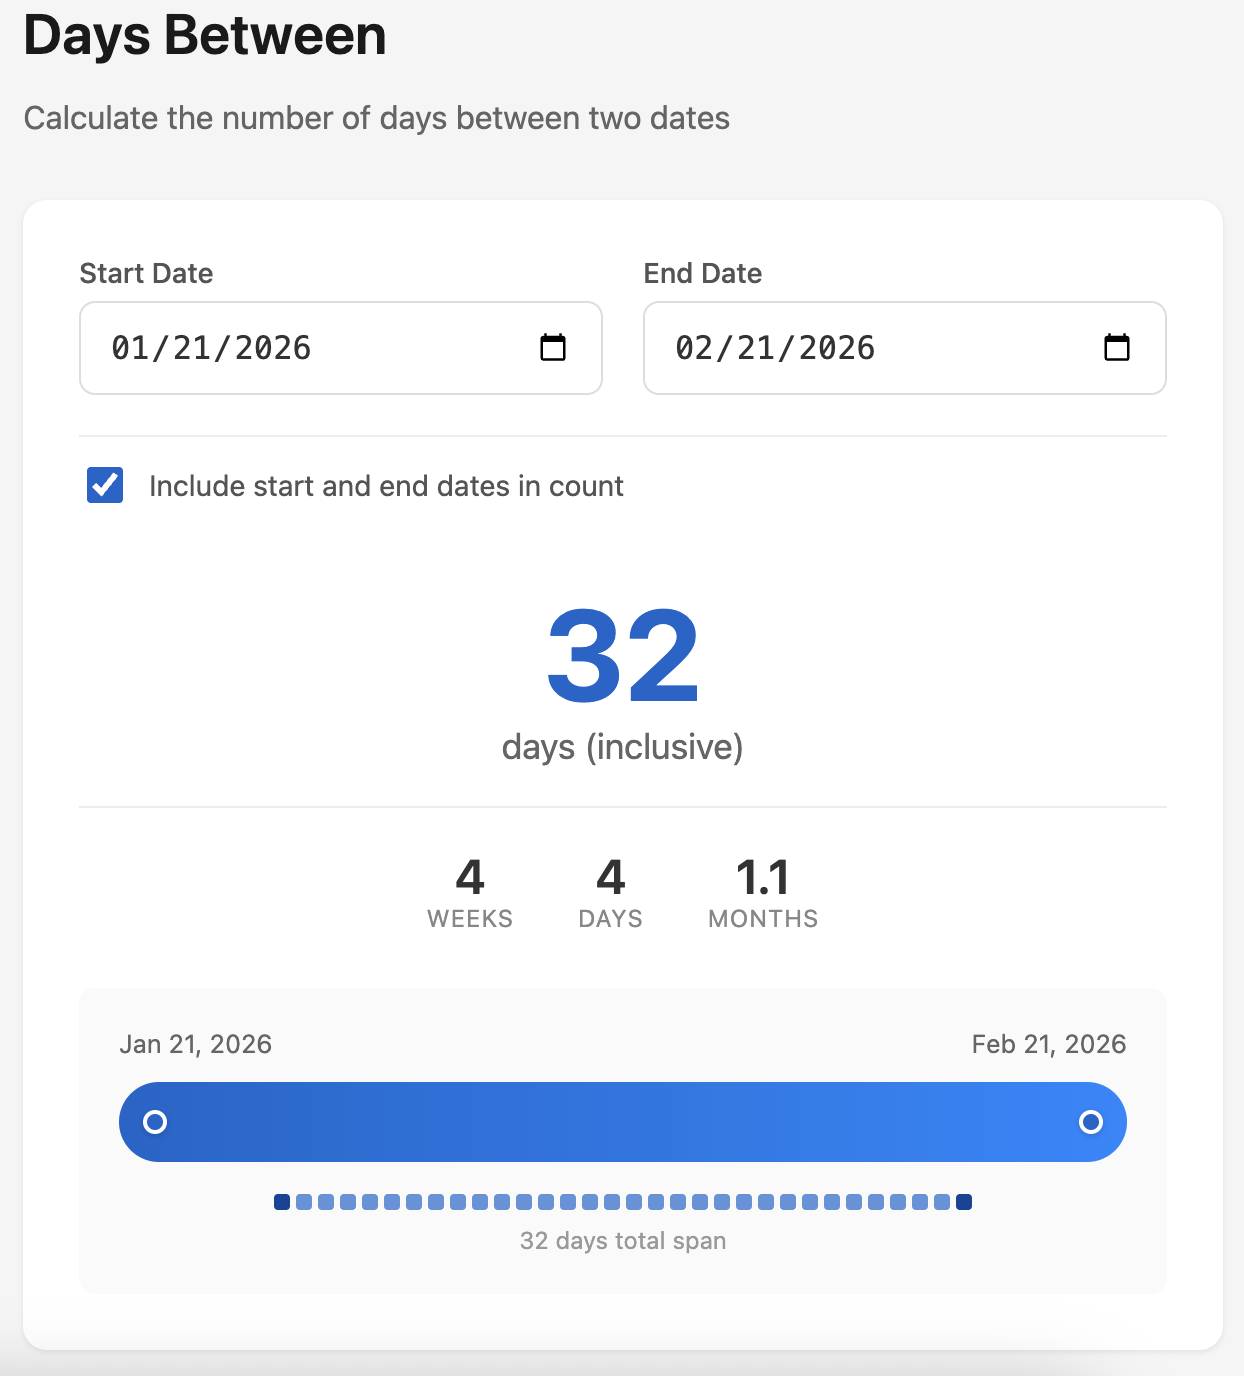
Date Between Calculator
Context: Coworker needed a days between calculator and I didn’t like the interface for the web-based ones.
Results: Quick query